Most Popular Ethnic Cuisines in America According to Google

America – built by immigrants and a melting pot of nationalities. And just like the people themselves, American food came from across the seas, or over the border. Even Apple Pie – so American – actually came from England, along with the apples.
America is a land of diversities – of peoples, of cultures, of climates and geographies, and of lifestyles. And while Americans’ food choices are incredibly varied, there is a clear battle for supremacy at the top of the charts.
Mexican and Chinese. While the souped-up, go-go-go East prefers one, the chilled out, take it easy West goes for the other. Mexican cuisine is the most popular ethnic cuisine in 27 states, Chinese food in 22 and Thai is the most popular cuisine in two states – Alaska and Hawaii.
Let’s see how the Americans’ culinary tastes shape up according to Google Trends data.

How We Crunched the Data
Google provides data on a whole range of topics, including national cuisines, and allocates a score that indicates the level of interest in the topic.
Google uses AI to categorize search terms for national cuisines. For example, Japanese cuisine will comprise hundreds or thousands of searches related to the topic such as Japanese restaurants, Japanese rice, sushi, sushi recipes, Japanese food, and even names of well-known Japanese restaurants.
Google then counts how often they are used at a national, state-, metro and city-level relative to all (local) searches and allocates an interest score.
For example, if San Francisco scores 100 for Indian cuisine and New York scores 60, it doesn’t mean more searches were done in San Francisco than in New York; it means a higher percentage of people in San Francisco than in New York searched for Indian cuisine.
What is unique about the data is that it doesn’t only indicate Americans’ dining out habits. It also shows what Americans are eating at home.
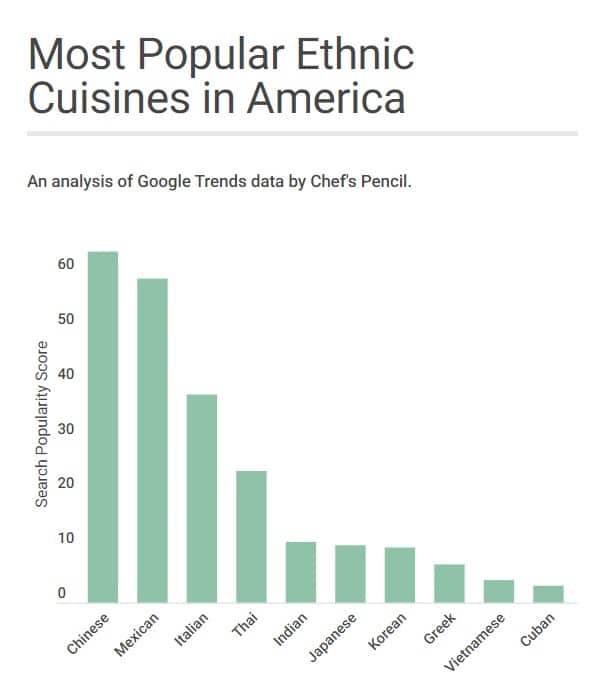
Let’s look in-depth at the top seven, showing each state’s and city’s preference for a cuisine. Read on to find out how the world’s food ranked in the US in 2019.
7. Korean (Popularity Score 11)
Korean – It might have been slow to take off, but Korean food is now huge in the States. Perhaps it’s the love of the BBQ or the focus on healthy eating. Whatever it is, looking at the high volume of searches for Korean food, the American public can hardly get enough.
Hawaii and its capital, – Honolulu, is the undisputed capital of Korean food in America. Korean food is twice as popular in Hawaii compared to runner-ups – Nevada and California, each scoring 51 on Google’s Korean food popularity index, with Washington state coming in forth.
City-wide, next to Honolulu, Paradise, NV, home to the Las Vegas strip, and Irvine, CA are the hot spots for Korean food. Los Angeles, CA and Santa Ana, CA in nearby Orange County close the top five.
Actually, LA and Orange counties are home to the largest and second-largest Korean population in the US and boast some fantastic Korean restaurants.

6. Japanese (Popularity Score 10.5)
Japanese – the pursuit of perfection, the sophistication, quality ingredients, and the mystery of Nippon have all inspired American chefs and consumers. It’s so much more than sushi – tonkatsu, chirashi-don, tempura, ramen, the names themselves create a sense of exploring.
Similar to Korean cuisine, it’s the good people in the state of Hawaii (100) leading the drive for this fresh, seasonal food. On the mainland, the Carolinas boast the highest interest in Japanese food, followed by California, Washington and New York.
City-wise it’s Honolulu that takes another crown as America’s capital of Japanese cuisine. Greensboro, NC, takes a surprising second place, with San Francisco and Oakland coming in third and fourth.

5. Indian (Popularity Score 11)
Indian – back in 2016, the Washington Post slammed the American public for its professed love of ethnic food which at the same time they saw as “inferior”. All that has most definitely changed.
With more Americans traveling further afield, they return yearning for the authentic taste of Indian cuisine, bringing the food to the forefront of American cuisine.
On a state level, New Jersey (92) scored the highest interest points for Indian food, followed by Washington (75), Maryland (73) and Massachusetts (72).
The clear capital for this aromatic cuisine is Fremont, California (100), while Jersey City (76) came in second. The top five is closed by Paradise, NV, Irving, TX and San Jose, CA.

4. Thai (Popularity Score 24)
Unlike most ethnic foods, Thai came to the States before the Thais.
That’s right. Americans went to Thailand, loads of them during the Cold War years, and they brought the taste back home. Later, Thai students came to the States and began opening up eateries because they missed mom’s cooking.
But it was in the early 2000s that Thai really took off. As part of its economic program, the Thai government began training chefs and sending them out to conquer the world, and they certainly conquered the States. More people became familiar with the food and culture, so more tourists went to Thailand. Win win.
But where in the States is it most popular?
Believe it or not, the state with the highest interest score is shivering Alaska (100). In fact Fairbanks, Alaska, has one of the highest ratios of Thai restaurants to population in the U.S. – 24 serving 32,000.
Thai is also hugely popular in the states of Washington and Oregon, with Portland and Seattle taking the share crown as America’s capitals of Thai food.

3. Italian (Popularity score 38)
Five million Italians arrived on America’s shores between 1876 and 1930. That’s pretty much all you need to know about how Italian cuisine became so popular in the New World.
National Geographic claims Italian food is as American as apple pie, which shows just how appropriated it is.
It started out as the food of the poor, looked down on as cheap and nasty. It became more popular in the 1940s, particularly in New York, and then in the 1970s and ‘80s it entered the realms of fine dining. The rest is history.
So loved is this cuisine that two states scored highest for Italian food popularity, New Jersey (100) and New York (97). Given the Italian-American connections in New York, it’s no surprise that Yonkers (100) and New York City (97) came first and second in the city interest ratings. Boston came in fourth, while Tampa, FL came in at a very respectable fourth place.

2. Mexican (Popularity Score 59)
Ethnic food is hugely popular in America, but the two top spots stand apart from the rest.
In the battle for ethnic cuisine supremacy, though, Mexican food came closely behind Chinese.
It’s not surprising that Mexican is so popular – they come from next door after all. What is surprising is that it took so long to cross the border. The cuisine didn’t really catch on until the Mexican Revolution in 1910, when south and central Mexicans joined their northern compatriots in seeking new lives, bringing with them the food of their home regions.
So strong has love of the taco become here, that tortillas began outselling hot dog buns back in 2010.
Whether it’s the fresh ingredients, the powerful flavors, the varied options, or that it’s cheap, Americans sure love it’s neighbor’s food. In fact, around 9% of the nation’s restaurants are Mexican. I think all those intrepid immigrants deserve a round of applause and the thanks of the nation!
The southern states certainly think so. Arizona (100) came top of the interest rate chart, Texas (88) second, Nevada (86) third, followed by Arkansas (84), and New Mexico (84).
The city with the biggest appreciation of Mexican cuisine is San Antonio, Texas (100), while San Diego and Sacramento in California came in second and third place.
Actually, Mexican pretty much dominates the south, west, and pretty much most of the Mid-West, with interest weakening the further north and east you go.

1. Chinese (Popularity Score 64)
Mexican might be big in the south and west, but Chinese food dominates the North East and takes the crown as the most searched for cuisine on Google.
The history of Chinese cuisine in the United States is longer and richer than that of Mexican. It was the glittering promise of the Gold Rush that first drew thousands of Chinese to these lands. Chinese restaurants quickly became known as some of the best on the new restaurant scene.
But that didn’t save them from anti-Chinese legislation, making it difficult for Chinese immigrants to work. They ended up working in restaurants and in service for the rich, and eventually, as the numbers of middle class with money to eat out began to grow, eating Chinese, an Americanized version, became all the rage.
Then, when people saw Nixon eating Peking Duck on a trip to China in 1972, interest piqued and demand grew for authentic Chinese rather than Chop Suey, noodles, and spring rolls.
There is also an interesting connection between the Jewish community and Chinese cuisine. When the Chinese were being discriminate against, there was also a lot of anti-Semitism. No top scale restaurant wanted Jewish clientele, but Jews were always welcome in Chinese restaurants. Also, both being non-Christian, Jews were able to eat out in a Chinese establishment when the Christian population was at home celebrating Christmas, and so began a tradition.
New Jersey (100) tops the interest chart for Chinese cuisine, while Delaware (98), New York (95) and Connecticut (94), all score in the 90s.
The city that comes top is Newark, NJ (100) and Philadelphia, PA (64) comes in second.

How does the US Stack up Against Other Countries
Chef’s Pencil has analyzed the popularity of ethnic cuisines in multiple countries, such as Canada, Australia, United Kingdom and Ireland. While many ethnic cuisines are popular world-wide, the differences between these five countries analyzed are more striking than the commonalities.
Chinese cuisine is the most popular cuisine in all the five countries analyzed except Australia, where, surprisingly, Thai took home the crown.
Mexican is hugely popular in the US, but it barely makes the top five in the other countries analyzed.
Italian, one of the most heralded cuisines globally, is outranked by Asian cuisines pretty much everywhere.
Methodology
Chef’s Pencil has analyzed Google Trends data for the year 2019. Google Trends popularity scores are relative and not absolute. Please see below how Google defines regional popularity scores:
Values are calculated on a scale from 0 to 100, where 100 is the location with the most popularity as a fraction of total searches in that location, a value of 50 indicates a location which is half as popular. A value of 0 indicates a location where there was not enough data for this term.
Note: A higher value means a higher proportion of all queries, not a higher absolute query count. So a tiny country where 80% of the queries are for “bananas” will get twice the score of a giant country where only 40% of the queries are for “bananas”.
Only cities with a population of over 100,000 were included in the study.
Fair Use and Redistribution
Chef’s Pencil grants you permission to reuse, host, or repost the graphics and images from this article. When doing so, we ask that you kindly attribute the authors by linking to Chef’s Pencil or this page.

Love it!